0

Regime Change

April 10, 2026 07:12 PM By alex.locker

The governing market traits "regime" changed in late 1Q26, showing more investor concern.


A market "regime" is defined by the governing set of traits and conditions that investors are subject to. You may have heard several terms previously that are types of regimes: bullish, bearish, risk-on, risk-off, etc. To better illustrate this concept, picture yourself driving on a long-distance trip.

  • How do you feel: alert or tired? Do you want to keep going according to your plans or stop for a while? This is like the investor, whose sentiment may differ depending on any number of factors.

  • How are the roads? Is the terrain straight and smooth, or are there curves, hills, &/orother obstacles ahead that may make you want to slow down? Do you want to look at an alternate route? This is like evaluating the equity markets: past conditions may not indicate how the conditions are ahead. Do you change your strategy or maintain the course?

  • How is the weather? Sunny with a clear forecast, or cloudy with a chance of gusting wind and thunderstorms later? This is like evaluating the economy. These are conditions that you have to deal with that you have absolutely no control over.

Market State: A Transition to "Risk Off?"

  • As of late March 2026, the market state has shifted from the bullish momentum seen at the start of the year toward a defensive, correction-oriented posture.

  • Geopolitical Dominance: The primary catalyst for recent price action is the escalating conflict with Iran. This has injected a high "risk premium" into equities and pushed the S&P 500 nearly 9% off its January highs ($7,002$), placing it on the doorstep of a formal 10% correction.

  • Sector Rotation: There is a pronounced "flight to quality."Investors have rotated out of high-growth technology and software valuations—which faced additional pressure from AI-disruption anxieties—and into Energy, Utilities, & Materials.

  • Volatility: The VIX has experienced a dramatic spike, briefly surging over 35 as markets price in the uncertainty of global energy supply chains and the potential for a "higher-for-longer" interest rate environment, once the battle for approving Fed Chair nominee Kevin Warsh is resolved. (Note: Warsh has previously stated his beliefs in a smaller balance sheet for the Federal Reserve, which would mean selling their Treasury bonds and taking funds out of circulation, and then using interest rates to spur economic activity rather than liquidity. This may be difficult to do given where inflation stands today.)

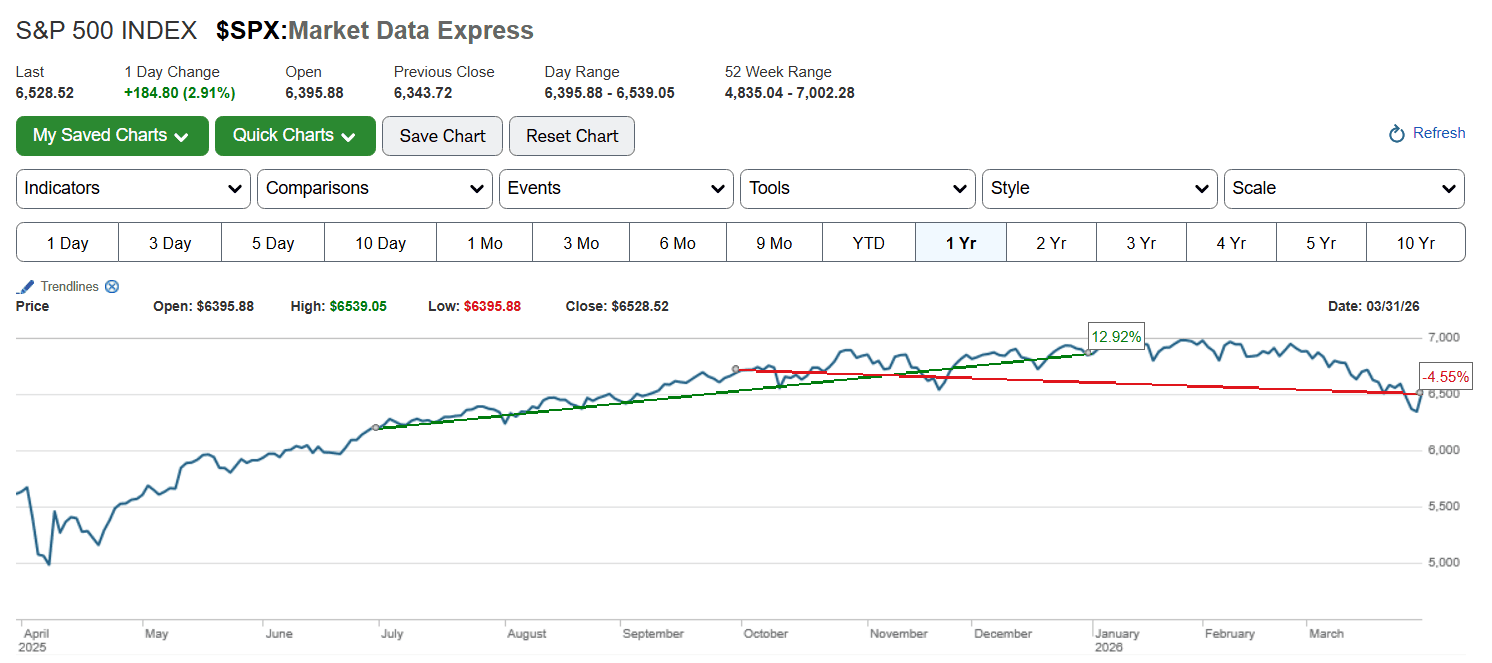
The chart's green line shows the growth of the S&P 500 for 3Q25 & 4Q25. However, the red line shows how the market performed during a rolling two-quarter period, from the start of 4Q25 to the end of 1Q26. The market regime changed from a bullish to a bearish state, with both flat market & economic trends as well. 

Looking back over the last six months (October 2025 – March 2026), we observe a distinct "arc" in market performance.


4Q25 =Steady appreciation, fueled by AI capital expenditures and strong year-end earnings.


Early 1Q26 = All-Time Highs. The index peaked above 7,000; optimism regarding a "soft landing" was at its zenith.


Late 1Q26 = Persistent Weakness. Geopolitical escalation and oil price shocks (breaching $100/bbl) led to a ~2.8% decline in March alone. The trend has transitioned from momentum-driven growth to volatility-driven contraction, with the 10-year Treasury yield climbing back toward 4.48%, reflecting a total reversal of the sub-4% expectations held only months ago.

Economic Trend Divergence

Hard Data: Resilient but Cooling   

The divergence between "Hard Data" (actual economic output) and "Soft Data" (sentiment-based indicators) has widened significantly over the last half-year.Hard data reflects an economy that is slowing down to its "cruising speed" but remains fundamentally sound. 

  • GDP Growth: Real GDP expanded by roughly 2.0% to 2.2% over the trailing six months. This growth is anchored by robust business investment in AI infrastructure and steady, albeit moderating, consumer spending.
  • Labor Market: The data is "wobbling." While the unemployment rate remains low at 4.3% – 4.4%, job growth has averaged near zero over the past six months, signaling that the rapid hiring phase of 2024-2025 has concluded.
  • Manufacturing: This remains a weak spot, with the ISM Manufacturing Index showing a 9-month contraction trend due to tariff uncertainties and high borrowing costs.
  •  Soft Data: The Pessimism Gap   

    In contrast to the steady GDP numbers, "soft" sentiment data is flashing red.

    • Consumer Sentiment: The University of Michigan index fell to 53.3 in March, its lowest since late 2025. Consumers are feeling the "inflationary impulse" of rising energy costs, with year-ahead inflation expectations jumping from 3.4% to 3.8% in a single month.
    • Business Outlook: While AI-focused firms remain optimistic, broader small-business sentiment is weighed down by the elimination of expected Fed rate cuts, with markets now pricing in a potential "hawkish hold" or even a slight hike to combat energy-driven inflation.

    Conclusion

    The economy is currently in a state of "Stagflationary Anxiety." Stagflation is defined as a period of stagnant economic growth with high/rising unemployment and high inflation. While the hard data (GDP and Earnings) suggests a healthy foundation, the soft data (Consumer Confidence) and Market State (Volatility) reflect a fear that the geopolitical oil shock could unravel the progress made on inflation over the past two years.


    Given the strong performance of the stock market in recent years and concerns over valuations, it would be understandable to have some pullback. The degree of the drawdown is the question given the geopolitical and economic concerns mentioned above.

    To review your current strategy through the lens of our Active Regime Awareness framework, click the button below to schedule a consultation.
    Schedule a Consultation

    alex.locker